

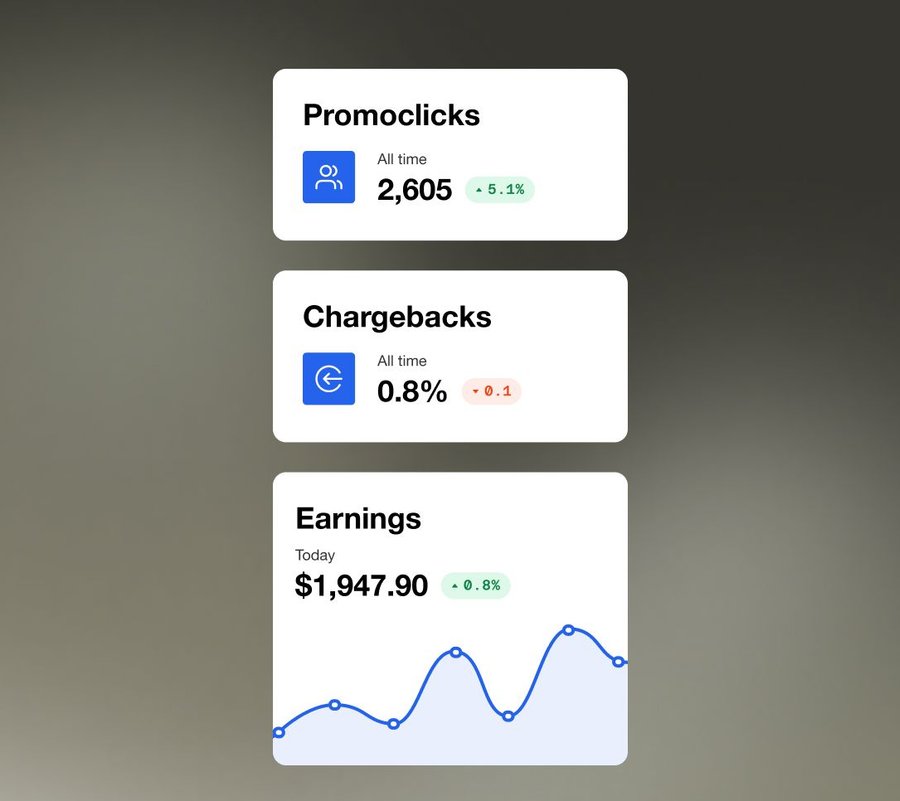
The reporting dashboard pulls data from every offer you promote and presents it in a unified view. Filter by date range, traffic source, product, or campaign to isolate the numbers you need. Revenue, clicks, conversions, refunds, and net earnings are all visible from the same screen, updated as transactions process.
All Your Numbers in One Place
See performance across every offer, every date range, and every traffic source from a single dashboard. No bouncing between disconnected reports. No exporting CSVs to compare campaigns. One view that shows you exactly how your affiliate business is performing.
How it Works
Full Performance Reporting
- Unified view across all offers. Every product you promote feeds into the same reporting system. Compare performance across your entire portfolio without switching between tools.
- Multi-dimensional filtering. Slice your data by offer, campaign, date range, or traffic source. Combine filters to answer specific questions about specific segments of your operation.
- Revenue, refunds, and net earnings together. Gross revenue tells one story. Net earnings after refunds tell the real one. Both are visible on the same screen so you always know the true picture.
Main Benefits
See Clearly Decide Faster
The affiliates who optimize fastest are the ones who see their data fastest.
01
Stop Switching Between Platforms02
Identify Winners and Cut Losers Sooner03
Track the Metric That Actually Matters

Ready for Reporting That Shows the Full Picture
One dashboard. Every offer. Every campaign. Every metric that matters to your bottom line. Open it, filter it, act on it.
Continue Exploring